Machine Learning Jobs

Machine Learning (ML)
UK

The table below provides summary statistics for permanent job vacancies requiring Machine Learning skills. It includes a benchmarking guide to the annual salaries offered in vacancies that cited Machine Learning over the 6 months leading up to 14 June 2025, comparing them to the same period in the previous two years.

6 months to
14 Jun 2025
Same period 2024 Same period 2023
Rank 53 68 115
Rank change year-on-year +15 +47 -63
Permanent jobs citing Machine Learning 2,526 3,706 2,752
As % of all permanent jobs advertised in the UK 4.51% 3.36% 2.99%
As % of the Processes & Methodologies category 4.86% 4.07% 3.13%
Number of salaries quoted 595 1,657 1,421
10th Percentile £46,250 £43,750 £45,751
25th Percentile £56,250 £52,500 £55,000
Median annual salary (50th Percentile) £80,000 £70,000 £70,000
Median % change year-on-year +14.29% - -6.67%
75th Percentile £97,528 £93,750 £90,000
90th Percentile £129,000 £115,000 £115,000
UK excluding London median annual salary £65,000 £60,000 £65,000
% change year-on-year +8.33% -7.69% +8.33%

All Process and Methodology Skills
UK

Machine Learning falls under the Processes and Methodologies category. For comparison with the information above, the following table provides summary statistics for all permanent job vacancies requiring process or methodology skills.

Permanent vacancies with a requirement for process or methodology skills 51,945 90,976 87,859
As % of all permanent jobs advertised in the UK 92.70% 82.55% 95.42%
Number of salaries quoted 25,967 62,719 53,482
10th Percentile £28,000 £29,750 £33,750
25th Percentile £40,000 £40,000 £45,000
Median annual salary (50th Percentile) £55,790 £55,000 £60,899
Median % change year-on-year +1.44% -9.69% +1.50%
75th Percentile £75,000 £72,500 £81,250
90th Percentile £97,500 £92,500 £100,000
UK excluding London median annual salary £50,055 £50,000 £55,000
% change year-on-year +0.11% -9.09% +4.76%

Machine Learning
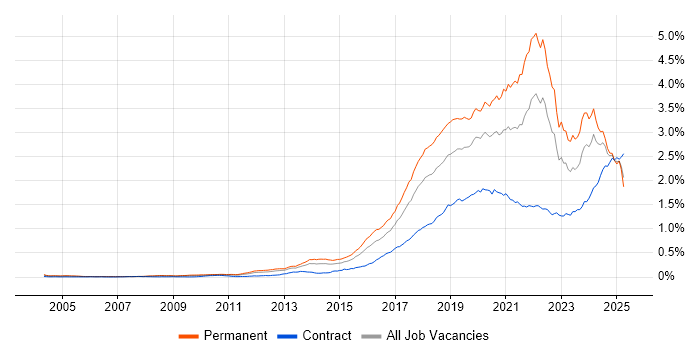
Job Vacancy Trend

Job postings citing Machine Learning as a proportion of all IT jobs advertised.

Job vacancy trend for Machine Learning in the UK

Machine Learning
Salary Trend

3-month moving average salary quoted in jobs citing Machine Learning.

Salary trend for Machine Learning in the UK

Machine Learning
Salary Histogram

Salary distribution for jobs citing Machine Learning over the 6 months to 14 June 2025.

Salary histogram for Machine Learning in the UK

Machine Learning
Top 19 Job Locations

The table below looks at the demand and provides a guide to the median salaries quoted in IT jobs citing Machine Learning within the UK over the 6 months to 14 June 2025. The 'Rank Change' column provides an indication of the change in demand within each location based on the same 6 month period last year.

Location Rank Change
on Same Period
Last Year
Matching
Permanent
IT Job Ads
Median Salary
Past 6 Months
Median Salary
% Change
on Same Period
Last Year
Live
Jobs
England +54 2,349 £80,000 +14.29% 4,401
UK excluding London +12 1,693 £65,000 +8.33% 2,014
Work from Home +66 1,392 £78,500 +20.77% 1,992
London +14 689 £90,000 +5.88% 2,967
South East +87 494 £67,500 +3.85% 913
North of England +48 467 £64,000 +16.36% 377
Midlands +129 384 £62,500 +8.70% 161
North West -5 294 £65,000 +18.18% 246
East Midlands +138 221 £65,000 +30.00% 87
West Midlands +64 161 £46,250 -22.92% 72
Yorkshire +104 148 £64,000 +28.00% 98
Scotland -43 135 £70,000 - 123
South West +26 132 £67,500 +3.85% 163
East of England +22 73 £65,127 +0.20% 186
North East +48 25 £52,000 +9.47% 33
Wales +39 6 £67,000 -0.74% 33
Northern Ireland +33 3 - - 46
Channel Islands -1 3 £80,000 +33.33% 40
Isle of Man +14 1 - -

Machine Learning
Co-occurring Skills and Capabilities by Category

The follow tables expand on the table above by listing co-occurrences grouped by category. The same employment type, locality and period is covered with up to 20 co-occurrences shown in each of the following categories:

Application Platforms
1 114 (4.51%) Apache Spark
2 36 (1.43%) Apache Airflow
3 34 (1.35%) Apache
4 23 (0.91%) Jupyter
5 18 (0.71%) SharePoint
6 9 (0.36%) Confluence
6 9 (0.36%) Oracle Workflow
6 9 (0.36%) SAS
7 8 (0.32%) Camunda
8 4 (0.16%) ArcGIS
8 4 (0.16%) Microsoft Exchange
8 4 (0.16%) Tomcat
9 2 (0.079%) Luigi
9 2 (0.079%) Skype for Business
10 1 (0.040%) CMS
Applications
1 36 (1.43%) Chatbot
2 22 (0.87%) Microsoft Excel
3 9 (0.36%) Maya
4 6 (0.24%) Microsoft Office
4 6 (0.24%) Microsoft PowerPoint
5 5 (0.20%) Adobe Creative Suite
5 5 (0.20%) Blender
5 5 (0.20%) CINEMA 4D
6 4 (0.16%) Adobe XD
6 4 (0.16%) Sketch
6 4 (0.16%) Trello
7 2 (0.079%) Simulink
8 1 (0.040%) MS Visio
8 1 (0.040%) S-PLUS
8 1 (0.040%) Spreadsheet
8 1 (0.040%) SPSS
8 1 (0.040%) SPSS Modeler
Business Applications
1 7 (0.28%) Adaptiv
2 6 (0.24%) SAP S/4HANA
3 4 (0.16%) Remedy ITSM
3 4 (0.16%) Salesforce CRM
4 3 (0.12%) SAP SCM
5 2 (0.079%) SAP LE
5 2 (0.079%) SAP MM
6 1 (0.040%) Dynamics CRM
6 1 (0.040%) Oracle EBS
6 1 (0.040%) Oracle ERP
6 1 (0.040%) SAP FI
6 1 (0.040%) SAP IBP
6 1 (0.040%) TrackWise
Cloud Services
1 793 (31.39%) AWS
2 781 (30.92%) Azure
3 576 (22.80%) GCP
4 281 (11.12%) Serverless
5 254 (10.06%) AWS Lambda
6 99 (3.92%) Power Platform
7 53 (2.10%) Amazon S3
8 51 (2.02%) Azure Machine Learning
9 46 (1.82%) Azure Data Factory
10 43 (1.70%) Amazon SageMaker
11 41 (1.62%) SaaS
12 36 (1.43%) Azure Synapse Analytics
13 33 (1.31%) Amazon EKS
13 33 (1.31%) GitHub
13 33 (1.31%) Snowflake
14 31 (1.23%) Cloud Computing
15 29 (1.15%) Amazon EC2
16 28 (1.11%) Amazon ECS
16 28 (1.11%) Vertex AI
17 27 (1.07%) PaaS
Communications & Networking
1 215 (8.51%) Broadband
2 14 (0.55%) HTTP
2 14 (0.55%) VPN
3 11 (0.44%) Internet
4 8 (0.32%) Firewall
5 7 (0.28%) DNS
5 7 (0.28%) SAN
6 5 (0.20%) WAN
7 4 (0.16%) DHCP
7 4 (0.16%) LoRaWAN
7 4 (0.16%) NAS
7 4 (0.16%) TCP/IP
8 3 (0.12%) PuTTY
8 3 (0.12%) SD-WAN
9 2 (0.079%) MQTT
9 2 (0.079%) Network Security
9 2 (0.079%) Skype
9 2 (0.079%) VLAN
10 1 (0.040%) Intrusion Detection
10 1 (0.040%) VoIP
Database & Business Intelligence
1 143 (5.66%) Big Data
2 101 (4.00%) NoSQL
3 98 (3.88%) Power BI
4 88 (3.48%) Data Lake
5 82 (3.25%) Data Warehouse
6 53 (2.10%) PostgreSQL
7 48 (1.90%) Hadoop
8 46 (1.82%) Relational Database
9 43 (1.70%) Tableau
10 38 (1.50%) SQL Server
11 37 (1.46%) Data Mining
12 32 (1.27%) Amazon Redshift
13 31 (1.23%) MySQL
14 28 (1.11%) Metadata
15 24 (0.95%) BigQuery
16 23 (0.91%) Elasticsearch
17 22 (0.87%) MongoDB
18 21 (0.83%) Amazon Athena
18 21 (0.83%) Amazon RDS
18 21 (0.83%) Apache Hive
Development Applications
1 94 (3.72%) Git
2 34 (1.35%) Jenkins
3 32 (1.27%) GitLab
4 30 (1.19%) JIRA
5 20 (0.79%) SonarQube
6 19 (0.75%) Sonatype Nexus
7 17 (0.67%) Selenium
7 17 (0.67%) Vite
8 15 (0.59%) JUnit
9 12 (0.48%) MLflow
10 9 (0.36%) Maven
11 8 (0.32%) Spinnaker
12 7 (0.28%) Locust
13 6 (0.24%) Cypress.io
14 5 (0.20%) CircleCI
14 5 (0.20%) ER Studio
14 5 (0.20%) Gradle
14 5 (0.20%) SoapUI
15 4 (0.16%) Postman
15 4 (0.16%) rollup.js
General
1 816 (32.30%) Retail
2 787 (31.16%) Manufacturing
3 571 (22.60%) Finance
4 541 (21.42%) Inclusion and Diversity
5 526 (20.82%) Analytical Skills
6 458 (18.13%) Law
7 396 (15.68%) Social Skills
8 212 (8.39%) Banking
9 196 (7.76%) Dutch Language
9 196 (7.76%) Finnish Language
9 196 (7.76%) Norwegian Language
10 188 (7.44%) Marketing
11 78 (3.09%) Legal
12 49 (1.94%) Catalan Language
12 49 (1.94%) Games
12 49 (1.94%) Influencing Skills
13 47 (1.86%) Public Sector
14 36 (1.43%) Investment Banking
15 27 (1.07%) Advertising
16 22 (0.87%) Telecoms
Job Titles
1 750 (29.69%) Trainer
2 737 (29.18%) Senior
3 495 (19.60%) Software Engineer
4 270 (10.69%) Lead
5 252 (9.98%) Senior Software Engineer
6 240 (9.50%) Machine Learning Engineer
7 159 (6.29%) Data Scientist
8 92 (3.64%) Developer
8 92 (3.64%) Java Engineer
9 90 (3.56%) Java Software Engineer
9 90 (3.56%) Lead Software Engineer
10 82 (3.25%) Python Engineer
11 78 (3.09%) Data Engineer
12 77 (3.05%) Architect
13 76 (3.01%) Senior Data Scientist
14 50 (1.98%) Analyst
14 50 (1.98%) Python Software Engineer
15 37 (1.46%) AWS Engineer
15 37 (1.46%) Solutions Architect
16 34 (1.35%) DevOps Engineer
Libraries, Frameworks & Software Standards
1 228 (9.03%) .NET
2 227 (8.99%) Node.js
3 121 (4.79%) React
4 107 (4.24%) PyTorch
5 104 (4.12%) TensorFlow
6 103 (4.08%) Kafka
7 96 (3.80%) HTML
8 92 (3.64%) Spring
9 78 (3.09%) REST
10 70 (2.77%) scikit-learn
11 56 (2.22%) Pandas
12 51 (2.02%) PySpark
12 51 (2.02%) RESTful
13 49 (1.94%) Spring Boot
14 48 (1.90%) NumPy
15 45 (1.78%) CSS
16 35 (1.39%) AngularJS
17 29 (1.15%) Hugging Face
18 28 (1.11%) LangChain
19 26 (1.03%) Web Services
Miscellaneous
1 800 (31.67%) Robotics
2 404 (15.99%) Self-Motivation
3 294 (11.64%) Algorithms
4 224 (8.87%) Cyberattack
5 181 (7.17%) Linux Command Line
6 128 (5.07%) Cloud Native
7 49 (1.94%) Analytical Mindset
7 49 (1.94%) Management Information System
8 46 (1.82%) Distributed Systems
9 38 (1.50%) Public Cloud
10 37 (1.46%) Product Ownership
11 33 (1.31%) FMCG
12 30 (1.19%) Virtual Team
13 25 (0.99%) Credit Risk
14 23 (0.91%) Enterprise Software
15 22 (0.87%) Greenfield Project
15 22 (0.87%) IoT
16 20 (0.79%) Data Structures
17 17 (0.67%) Legacy Systems
17 17 (0.67%) Mobile App
Operating Systems
1 222 (8.79%) Linux
2 31 (1.23%) Windows
3 15 (0.59%) Windows Server
4 14 (0.55%) Unix
5 6 (0.24%) Android
5 6 (0.24%) Apple iOS
6 5 (0.20%) Mac OS X
6 5 (0.20%) VMS
7 4 (0.16%) Ubuntu
7 4 (0.16%) Windows Server 2019
8 3 (0.12%) Debian
8 3 (0.12%) Embedded Linux
9 2 (0.079%) CentOS
9 2 (0.079%) Red Hat Enterprise Linux
9 2 (0.079%) Robot Operating System
9 2 (0.079%) Windows Server 2003
Processes & Methodologies
1 1,765 (69.87%) Artificial Intelligence
2 1,376 (54.47%) Problem-Solving
3 924 (36.58%) LLM
4 911 (36.06%) Agile
5 895 (35.43%) Generative AI
6 735 (29.10%) Red Team
7 729 (28.86%) Data Science
8 633 (25.06%) Data Privacy
9 612 (24.23%) Software Engineering
10 587 (23.24%) CI/CD
11 545 (21.58%) Mentoring
12 509 (20.15%) Analytics
13 382 (15.12%) Data Engineering
14 309 (12.23%) Computer Science
15 269 (10.65%) Visualisation
16 266 (10.53%) Microservices
17 259 (10.25%) Decision-Making
18 254 (10.06%) User Experience
19 252 (9.98%) DevOps
20 239 (9.46%) SDLC
Programming Languages
1 1,094 (43.31%) Python
2 479 (18.96%) Java
3 393 (15.56%) SQL
4 344 (13.62%) JavaScript
5 331 (13.10%) TypeScript
6 303 (12.00%) C++
7 235 (9.30%) Rust
8 201 (7.96%) Go
9 124 (4.91%) C#
10 114 (4.51%) R
11 75 (2.97%) C
12 72 (2.85%) MATLAB
13 59 (2.34%) PHP
14 50 (1.98%) Scala
15 49 (1.94%) Dart
15 49 (1.94%) Ruby
16 23 (0.91%) PowerShell
17 21 (0.83%) Bash
18 15 (0.59%) Kotlin
19 14 (0.55%) Data Analysis Expressions
Qualifications
1 1,389 (54.99%) Degree
2 314 (12.43%) PhD
3 290 (11.48%) Security Cleared
4 254 (10.06%) DV Cleared
5 215 (8.51%) AWS Certification
6 194 (7.68%) AWS Certified Solutions Architect
7 184 (7.28%) AWS Certified Developer
8 165 (6.53%) Computer Science Degree
9 119 (4.71%) Master's Degree
10 34 (1.35%) Azure Certification
10 34 (1.35%) SC Cleared
11 31 (1.23%) Numerate Degree
12 19 (0.75%) PMI Certification
13 18 (0.71%) PMP
14 15 (0.59%) DBS Check
15 13 (0.51%) CFA
16 9 (0.36%) ITIL Certification
17 7 (0.28%) BPSS Clearance
17 7 (0.28%) Postgraduate
18 6 (0.24%) Microsoft Certification
Quality Assurance & Compliance
1 80 (3.17%) Data Quality
2 55 (2.18%) GDPR
3 53 (2.10%) Accessibility
4 30 (1.19%) QA
5 22 (0.87%) California Consumer Privacy Act
6 19 (0.75%) ISO/IEC 27001
7 16 (0.63%) Actionable Recommendations
8 8 (0.32%) NIST
9 7 (0.28%) SOC 2
10 6 (0.24%) IFRS
10 6 (0.24%) IFRS 9
11 4 (0.16%) WCAG
12 3 (0.12%) Cyber Essentials
12 3 (0.12%) Cyber Essentials PLUS
12 3 (0.12%) GxP
13 2 (0.079%) GMP
13 2 (0.079%) SLA
14 1 (0.040%) GLP
14 1 (0.040%) ISO 9001
14 1 (0.040%) Sarbanes-Oxley
System Software
1 182 (7.21%) Docker
2 12 (0.48%) VMware Infrastructure
3 11 (0.44%) HDFS
4 10 (0.40%) Active Directory
5 8 (0.32%) Apache Flume
6 7 (0.28%) VMware ESXi
7 6 (0.24%) Hyper-V
8 3 (0.12%) LXC
8 3 (0.12%) Virtual Machines
Systems Management
1 207 (8.19%) Kubernetes
2 125 (4.95%) Terraform
3 44 (1.74%) Ansible
4 36 (1.43%) Grafana
5 26 (1.03%) Prometheus
6 8 (0.32%) Oozie
7 5 (0.20%) Jamf Pro
8 4 (0.16%) Argo
8 4 (0.16%) ITRS Geneos
8 4 (0.16%) Kibana
8 4 (0.16%) Kubeflow
8 4 (0.16%) logstash
8 4 (0.16%) Netcool
8 4 (0.16%) Netcool/OMNIbus
8 4 (0.16%) Puppet
8 4 (0.16%) SCOM
8 4 (0.16%) Single Sign-On
8 4 (0.16%) Tivoli
9 3 (0.12%) Packer
10 2 (0.079%) SCOrch
Vendors
1 879 (34.80%) Databricks
2 860 (34.05%) Google
3 744 (29.45%) Adobe
4 149 (5.90%) Microsoft
5 68 (2.69%) OpenAI
6 49 (1.94%) Oracle
7 38 (1.50%) SAP
8 34 (1.35%) Splunk
9 27 (1.07%) ServiceNow
10 19 (0.75%) Dynatrace
11 16 (0.63%) Murex
12 14 (0.55%) Apple
13 12 (0.48%) Informatica
13 12 (0.48%) Palantir
13 12 (0.48%) Salesforce
13 12 (0.48%) VMware
13 12 (0.48%) Workday
14 11 (0.44%) Foundry
15 10 (0.40%) Cloudera
16 9 (0.36%) MuleSoft